 GeoData.NZ
Ice Shelf
Type of resources
Available actions
Topics
Keywords
Contact for the resource
Provided by
Years
Update frequencies
status
-
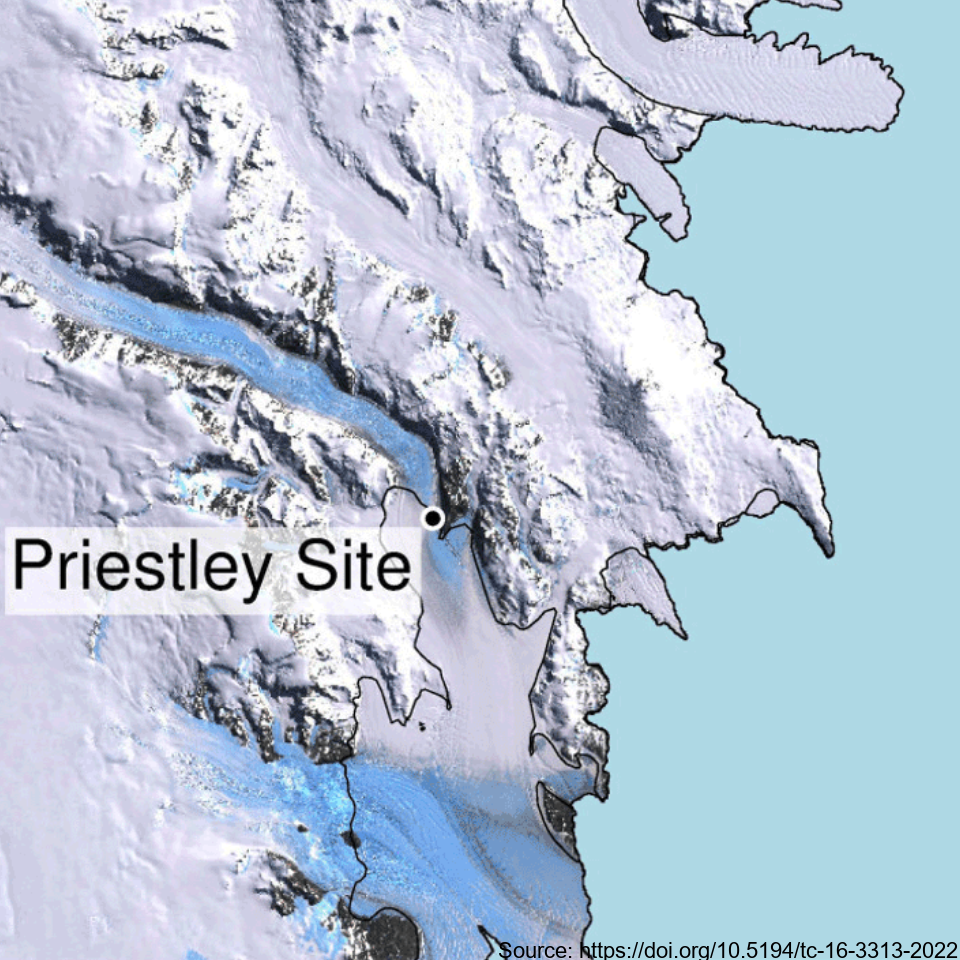
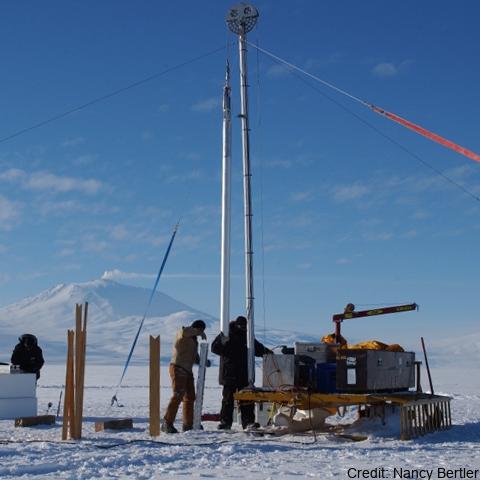
This metadata record represents the first direct comparison of seismic and ultrasonic data with measured crystallographic preferred orientations Crystallographic preferred orientations (CPO) in a polar shear margin (Priestly Glacier, Antarctica). Analyses of seismic, ultrasonic and measured CPO datasets were combined to assess the potential of active-source seismic surveys for the constraint of shear margin anisotropy, which provide an assessment of ice flow dynamics and stability. A continuous ice core of 58 m length was drilled and recovered in December 2019 and January 2020 in a lateral shear margin of the Priestley Glacier, located in Victoria Land, Antarctica. Core samples were analysed for CPO using electron backscatter diffraction (EBSD) measurements. The core orientation was carefully preserved during drilling, which enabled azimuthal orientation of the CPO. To complete the link between seismic anisotropy of the ice volume around the borehole and CPO measurements from the core, multi-azimuthal ultrasonic velocity measurements were made on core samples in the laboratory. The vertical-seismic-profile (VSP) dataset was recorded at the Priestley drill site using a three-component borehole seismometer to investigate seismic properties and anisotropy within the glacier ice. Additionally, multi-azimuthal ultrasonic velocity measurements were conducted on core samples in the laboratory, complementing the seismic data analysis. Further details are provided at: Lutz, F., Prior, D.J., Still, H., Hamish Bowman, M., Boucinhas, B., Craw, L., Fan, S., Kim, D., Mulvaney, R., Thomas, R.E., & Hulbe, C.L. (2022). Ultrasonic and seismic constraints on crystallographic preferred orientations of the Priestley Glacier shear margin, Antarctica. *Cryosphere*, 16(8), 3313-3329. https://doi.org/10.5194/tc-16-3313-2022 GET DATA: https://auckland.figshare.com/articles/dataset/Priestley_Glacier_seismic_and_ultrasonic_constraints_on_crystallographic_orientation/17108639
-
Here, we present a decadally resolved record of sea-salt sodium (a proxy for open-ocean area) and non-sea salt calcium (a proxy for continental dust) from the well-dated Roosevelt Island Climate Evolution (RICE) core, focusing on the time period between 40–26 ka BP. Drilling site coordinates: (79.364° S, 161.706°W). Further collection details can be found at https://doi.org/10.1038/s41467-023-40951-1
-
In Antarctica, ice shelves such as the Ross Ice Shelf (RIS) fringe 75% of the coastline and cover over 1.5 million km2, creating distinct and largely unexplored marine environments. It is fundamental to characterize the communities under these shelves to understand their biogeochemical role and predict how they might respond to future ice-shelf collapse 1,2. While historical studies suggested the RIS harbors active microorganisms 3–5, nothing is known about the composition of these communities. In this study, we profiled the composition, function, and activities of microbial communities in three seawater samples (400, 550, 700 m depth) underlying the shelf interior. We combined rate measurements with multi-omics (i.e. single-cell genomics, metagenomics, metatranscriptomics, and metaproteomics). Overall, below-shelf waters harbour microbial communities of comparable abundance and diversity to deep pelagic waters. Based on the meta-omic data, the community is inferred to be sustained by dark carbon fixation using ammonia, nitrite, and sulfur compounds as electron donors. In turn, these chemolithoautotrophs are predicted to support the aerobic heterotrophic majority and various trophic interactions. Consistently, this study and previous activity measurements suggest that dark carbon fixation is sufficient to sustain prokaryotic heterotrophic production, making the waters below the RIS presumably the largest chemolithotrophic system in the global ocean. Further details are provided at https://doi.org/10.1038/s41467-021-27769-5 GET DATA: https://www.ebi.ac.uk/ena/browser/view/PRJEB35712 GET DATA: https://www.ncbi.nlm.nih.gov/bioproject/?term=PRJNA593264
-
The data are approximately 800 km of airborne electromagnetic survey of coastal sea ice and sub-ice platelet layer (SIPL) thickness distributions in the western Ross Sea, Antarctica, from McMurdo Sound to Cape Adare. Data were collected between 8 and 13 November 2017, within 30 days of the maximum fast ice extent in this region. Approximately 700 km of the transect was over landfast sea ice that had been mechanically attached to the coast for at least 15 days. Most of the ice was first-year sea ice. Unsmoothed in-phase and quadrature components are presented at all locations. Data have been smoothed with an 100 point median filter, and in-phase and quadrature smoothed data are also presented at all locations. Beneath level ice it is possible to identify the thickness of an SIPL and a filter is described (Langhorne et al) to identify level ice. Level ice in-phase, quadrature and SIPL thickness, derived from these, are presented at locations of level ice. For rough ice, the in-phase component is considered the best measure of sea ice thickness. For level ice where there is the possibility of an SIPL, then the quadrature component is considered the best measure of ice thickness, along with SIPL thickness. All data are in meters.
-
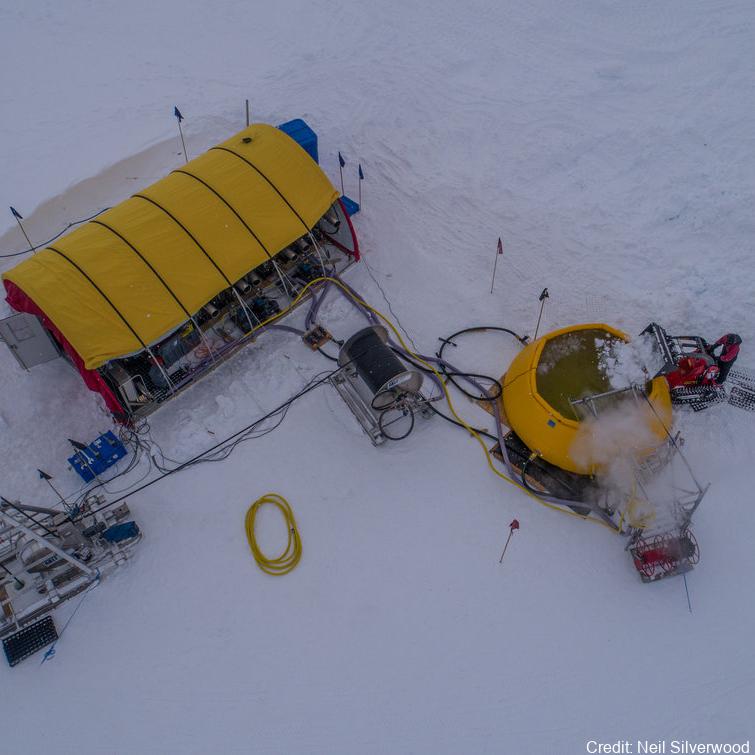
Here we provide data from the Ross Ice Shelf ocean cavity. The HWD2 Camp was established in October of 2017 at (-80 39.497, 174 27.678) where the ice is moving seaward at around ~600 m a-1 and is sourced from the Transantarctic Mountains. Profiling Instruments - Profiling was primarily conducted with an RBR Concerto CTD (conductivity-temperature depth) profiling instrument, and this was cross-calibrated against irregular profiles with an RBR Duet (pressure and temperature only), a SBE37 MicroCat CTD as well as moored SBE37 MicroCat CTDs. The RBR unit is small and has suitable sensor capability (temperature and conductivity accuracies of ±0.002°C and ±0.003 mS cm-1). Its conductivity cell design is not prone to fouling by ice crystals, making it ideal for work in the sometimes crystal-laden borehole conditions. We were inconsistent in how we mounted the CTD on its protective frame and this appeared to make small difference in the conductivity signal (resulting in an ~0.03 psu variation). This was post-corrected based on the essentially invariant mooring data from the lower water column as well as SBE37 cross-calibration profile data. Because of the potential for sediment contamination of the sensors, the profiles were mostly conservative in their proximity to the sea floor. On several occasions, profiles were conducted all the way to the sea floor. The temperature and salinity are presented in EOS-80 in order to compare with available data. Eighty-three profiles are provided here (ctd_HWD2_*.dat). In addition, limited microstructure profiling was conducted to provide insight into some of the mixing details. The profiles were conducted by lowering the instrument to the ice base then commencing a sequence of three up-down “yo-yos” before returning to the surface and downloading. A data segment is included here (VMP_HWD2.dat). There were some challenges registering the vertical coordinate for the profiles. The melting of the borehole generates a trapped pool of relatively fresh water. The interface between this and the ocean should be near the base of the hole or a little higher – with seawater intrusion. However, there were some instances where the interface was at a higher pressure (i.e. apparently in the open water column). The best explanation for this is that the water in the borehole is not at static equilibrium for some period after initial melting. We use 34.3 psu as a cut-off, in addition to a pressure criterion to identify the top of the useful oceanic profile. It is also not inconceivable that water was being ejected from the hole, but it is unlikely that this would have impacted in the consistent observed pattern. Instrumented Mooring - The mooring instruments at HWD2-A comprised 5 Nortek Aquadopp single point current meters in titanium housings reporting to the surface (30-minute interval, Table SI-Three) via an inductive modem to a Sound-9 data logger and Iridium transmitter. The current meter measurements were corrected to account for the 138° magnetic declination offset (i.e. the south magnetic pole is to the north-west of the field site). Five files are provided here (HWD2_Init_rcm*.dat4). Stevens Craig, Hulbe Christina, Brewer Mike, Stewart Craig, Robinson Natalie, Ohneiser Christian, Jendersie Stefan (2020). Ocean mixing and heat transport processes observed under the Ross Ice Shelf control its basal melting. Proceedings of the National Academy of Sciences, 117 (29), 16799-16804. https://doi.org/10.1073/pnas.1910760117
-

Ground-based electromagnetic induction (EM) surveys of sea ice and sub-ice platelet layer thicknesses were carried out on land-fast sea ice in McMurdo Sound, Antarctica in November of 2011, 2013, 2016 and 2017. The EM data was acquired using a frequency-domain Geonics Ltd EM31-MK2 instrument mounted on a sledge and towed by skidoo. The thicknesses of total ice (sea ice plus the snow layer) and the SPL were simultaneously retrieved from the EM31 measured response using the processing method of Irvin (2018) (refer to pages 89-98). A correction for the addition of the snow layer was applied to obtain to EM measured Sea Ice (emSI) thickness according to section 2.3 of Brett et al. 2019. Related Publication: Brett, G. M., Irvin, A., Rack, W., Haas, C., Langhorne, P. J., & Leonard, G. H. (2020). Variability in the distribution of fast ice and the sub-ice platelet layer near McMurdo Ice Shelf. Journal of Geophysical Research: Oceans, 125, e2019JC015678. https://doi.org/10.1029/2019JC015678 GET DATA: https://doi.pangaea.de/10.1594/PANGAEA.909889
-
This metadata record represents the data for generated by mining single-cell genomic, transcriptomic, and metagenomic data to uncover the viral diversity, biogeography, activity, and their role as metabolic facilitators of microbes beneath the Ross Ice Shelf. Hot drilling and seawater sampling was conducted from the sub-shelf water column in the central region of the RIS (Latitude −80.6577 N, Longitude 174.4626 W). The sampling site was located ≈300 km from the shelf front. A borehole (30 cm diameter) conducted by hot water drilling was used for direct sampling of seawater from three depths (400 m, 550 m, and 700 m from the top of the shelf, which correspond to 30 m, 180 m, and 330 m from the bottom of the ice shelf, respectively). Seawater samples were processed accordingly for single cell genomics, metagenomics, and transcriptomics as described5, and the resulting assembled and co-assembled contigs (min. length 1 kb) from single-amplified genomes, bins and transcriptomics were mined for detecting viral contigs. Further details are provided at https://doi.org/10.1038/s41467-023-44028-x GET DATA: https://doi.org/10.6084/m9.figshare.24581331
-
These data are described in detail by 'Melting and refreezing in an ice shelf basal channel at the grounding line of the Kamb Ice Stream. ApRES observations were made in December 2019 and repeated in December 2020 at the same locations. Data collection and processing followed the method described in Stewart et al. (2019). ApRES dataset.zip' contains raw ApRES data and processed results from a spatial survey of basal mass balance - detailed in Sections 2.2.4 and 3.2.2 of: Whiteford, A., Horgan, H. J., Leong, W. J., & Forbes, M. (2022). Melting and refreezing in an ice shelf basal channel at the grounding line of the Kamb Ice Stream, West Antarctica. Journal of Geophysical Research: Earth Surface, 127, e2021JF006532. https://doi.org/10.1029/2021JF006532 GET DATA: https://doi.org/10.5281/zenodo.5574647
-
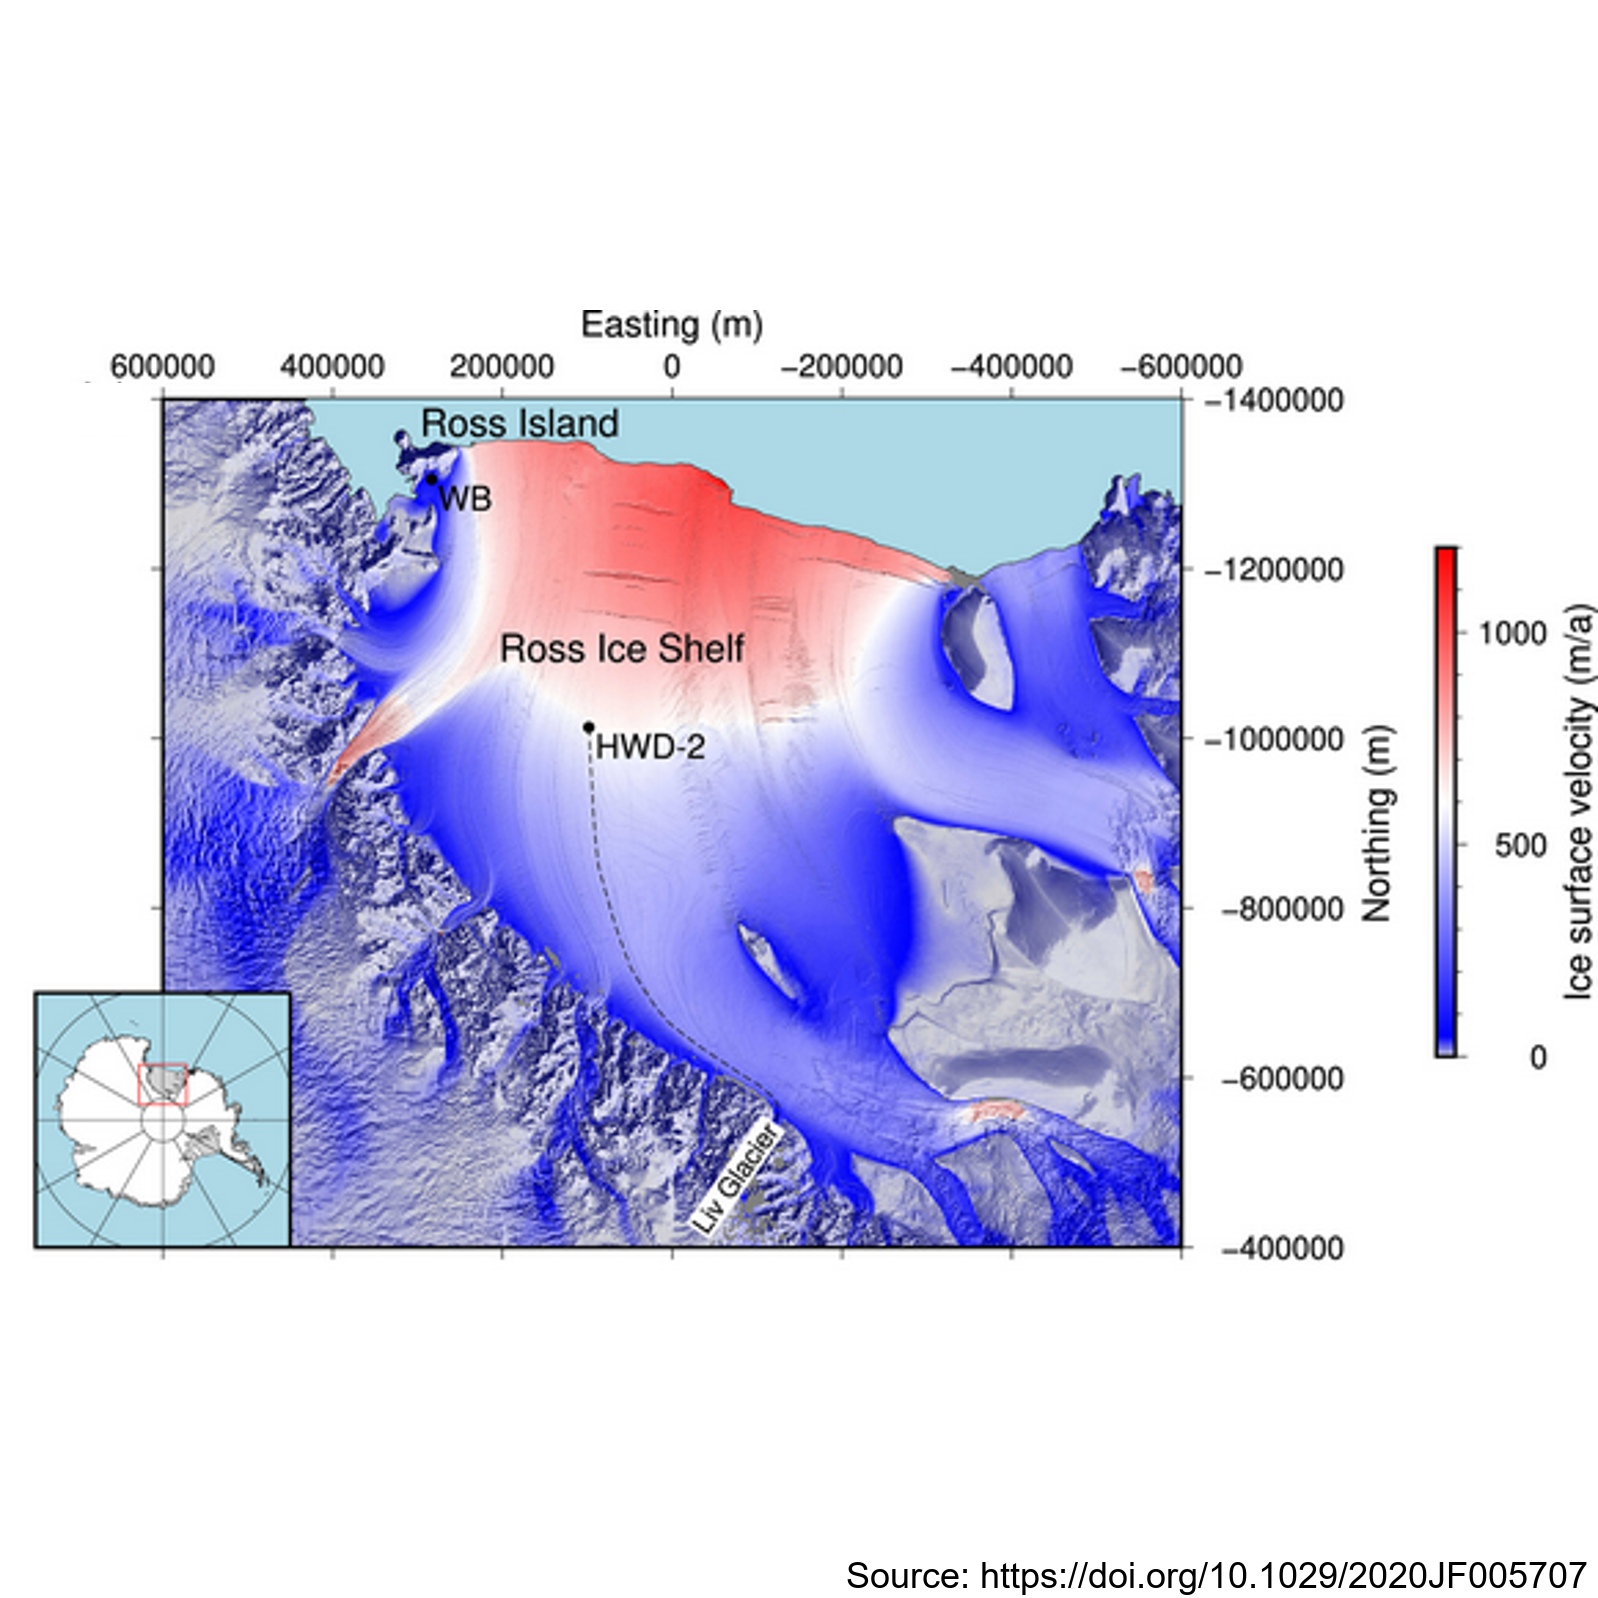
This metadata record presents observations of ice shelf anisotropy derived from borehole seismic data. Hot-water-drilled boreholes were created at two sites: Windless Bight (WB) near the grounding line on Ross Island and HWD-2 in the central Ross Ice Shelf. The boreholes housed seismometers frozen at various depths within the ice, enabling seismic observations of shear wave splitting (SWS) using active seismic sources. At Windless Blight, borehole seismometers were installed at depths of 40 and 190 meters within the ∼220 m thick ice shelf during the 2016/2017 Antarctic field season. Seismic shots were recorded with a 2,000 Hz sampling rate and a 2 s record length, triggered by striking plates. The site was revisited in December 2017 to validate sensor survivability and reproduce survey geometry for SWS analysis using multiazimuth shots. At HWD-2, eight seismometers were deployed at depths ranging from 80 to 325 meters inside the ∼370 m thick ice shelf during the 2017/2018 field season. A total of 747 shots at 53 different shot points were recorded, with clear observations of split shear waves in the data. The study contributes valuable seismic data and methodology for understanding ice shelf anisotropy, enhancing our knowledge of Antarctic ice dynamics and seismic behavior. Further details are provided at: Lutz, F., Eccles, J., Prior, D. J., Craw, L.,Fan, S., Hulbe, C., et al. (2020). Constraining ice shelf anisotropy using shear wave splitting measurements from active‐source borehole seismics.Journal of Geophysical Research: EarthSurface,125, e2020JF005707. https://doi.org/10.1029/2020JF005707 GET DATA: https://auckland.figshare.com/s/9f783802272b825d7ad7
-
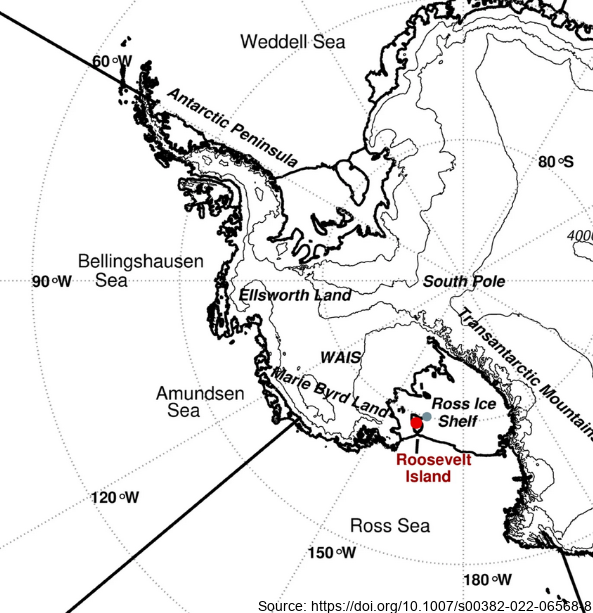
Here we examine the water stable-isotope data from the Roosevelt Island Climate Evolution (RICE) ice core. In this study, we use empirical orthogonal function (EOF) analysis to investigate the relationship between RICE ice-core oxygen-18 isotopes (δ18O) and Southern Hemisphere atmospheric circulation during the extended austral winter (April–November). - Deep Location: 79.364°S, 161.706°W, elevation 550 m a.s.l. - 12/13B Location: 79.362°S, 161.698°W, elevation 550 m a.s.l. - Core depth 763 m. Depth interval provided here: 1.29 to 38.56 m - txt data file, NaN = no data Further details are available at https://doi.org/10.1007/s00382-022-06568-8 GET DATA: https://github.com/demanuelsson/ClimDyn_2022_Matlab/tree/main/data